You ran kubectl apply, your terminal said “pod created,” but the app is still down. Sound familiar?
I’ve been there. 2 AM. Production alert firing. Pod shows Running but requests are failing. No obvious errors. That’s when I realized — I didn’t actually understand the Pod lifecycle. I just knew enough to deploy things and pray.
Once I truly understood what happens between kubectl apply and a Pod actually serving traffic, debugging became 10x faster. So let me walk you through the entire Kubernetes Pod lifecycle — not the textbook version, the version that actually helps you in production.
")
What Even Is a Pod?
Before we dive into lifecycle phases, let’s get the definition right — not the documentation copy-paste, but the real deal.
A Pod is a wrapper around one or more containers. Those containers share the same network (same IP), the same storage volumes, and — most importantly — the same lifecycle. If the Pod dies, all containers inside it die together.
Think of a Pod like a small apartment. The containers are roommates sharing one address. Kubernetes manages the building (the cluster), but it doesn’t care about keeping any one apartment forever. Pods are disposable by design.
The 5 Pod Lifecycle Phases
Phase 1: Pending
This is where every Pod starts. You’ve submitted the YAML, the API server accepted it — but the Pod hasn’t landed on any node yet.
Kubernetes is doing a lot of work behind the scenes here. The Scheduler is scanning all nodes, checking CPU/memory availability, taints, tolerations, node affinity rules, and topology constraints. Meanwhile, if your Pod needs a PersistentVolume, that has to be bound too.
Real scenario: You deploy a new service, and the Pod just sits in Pending for minutes. Nine times out of ten, it’s one of these:
- Not enough CPU or memory on any node (
Insufficient cpuin events) - The
nodeSelectordoesn’t match any node label - The PVC is stuck because the StorageClass can’t provision a volume
kubectl describe pod <pod-name>
# Scroll to the Events section — it tells you exactly what's wrong
Never ignore a Pending Pod. It will tell you everything if you just ask it.
Phase 2: Running
The Scheduler has picked a node. The Kubelet on that node has pulled the container image and started the containers. At least one container is up and running.
Here’s the thing most beginners miss: Running does NOT mean healthy. It just means the process started. Your app could be mid-initialization, throwing errors internally, or stuck waiting for a database connection — and Kubernetes still calls it “Running.”
This is the phase where your health probes take center stage (more on those shortly).
Also important: a Pod is permanently tied to one node. Once assigned, Kubernetes won’t move it elsewhere. If that node goes down, the Pod dies — and a new Pod gets created on a different node. Same workload, different Pod, different name.
Phase 3: Succeeded
All containers inside the Pod ran their task, completed it cleanly, and exited with status code 0.
You’ll mostly see this with Jobs and CronJobs — batch workloads like a DB migration script, a nightly report generator, or a one-time data cleanup task.
A typical web server Pod will never hit this phase on its own. It’s designed to run forever — unless you shut it down.
Phase 4: Failed
One or more containers exited with a non-zero exit code. Something went wrong.
The container might have crashed because of a bug, a missing environment variable, a secret that wasn’t mounted, or it ran out of memory (OOMKilled). Kubernetes marks the Pod as Failed and, depending on the restart policy, either restarts the container or gives up.
The first command you should run:
kubectl logs <pod-name> --previous
The --previous flag is gold. It shows you logs from the container before it crashed — the actual dying words of your app. Most people forget this flag and wonder why kubectl logs shows nothing useful.
Phase 5: Unknown
This one is spooky. Kubernetes lost contact with the node. The Pod’s state genuinely cannot be determined — the node isn’t responding, the Kubelet is silent.
After a grace period (typically around 5 minutes), Kubernetes applies the node.kubernetes.io/unreachable taint and eventually marks those Pods as Unknown. Then it deletes them and lets your Deployment create fresh ones on healthy nodes.
You’ll sometimes see Pods stuck in Terminating or Unknown for a long time after a node failure. That’s usually because finalizers are blocking the deletion. In those cases:
kubectl patch pod <pod-name> -p '{"metadata":{"finalizers":[]}}' --type=merge
Use that carefully — only when you’re sure the node is truly gone.
What Happens Under the Hood — The Full Flow
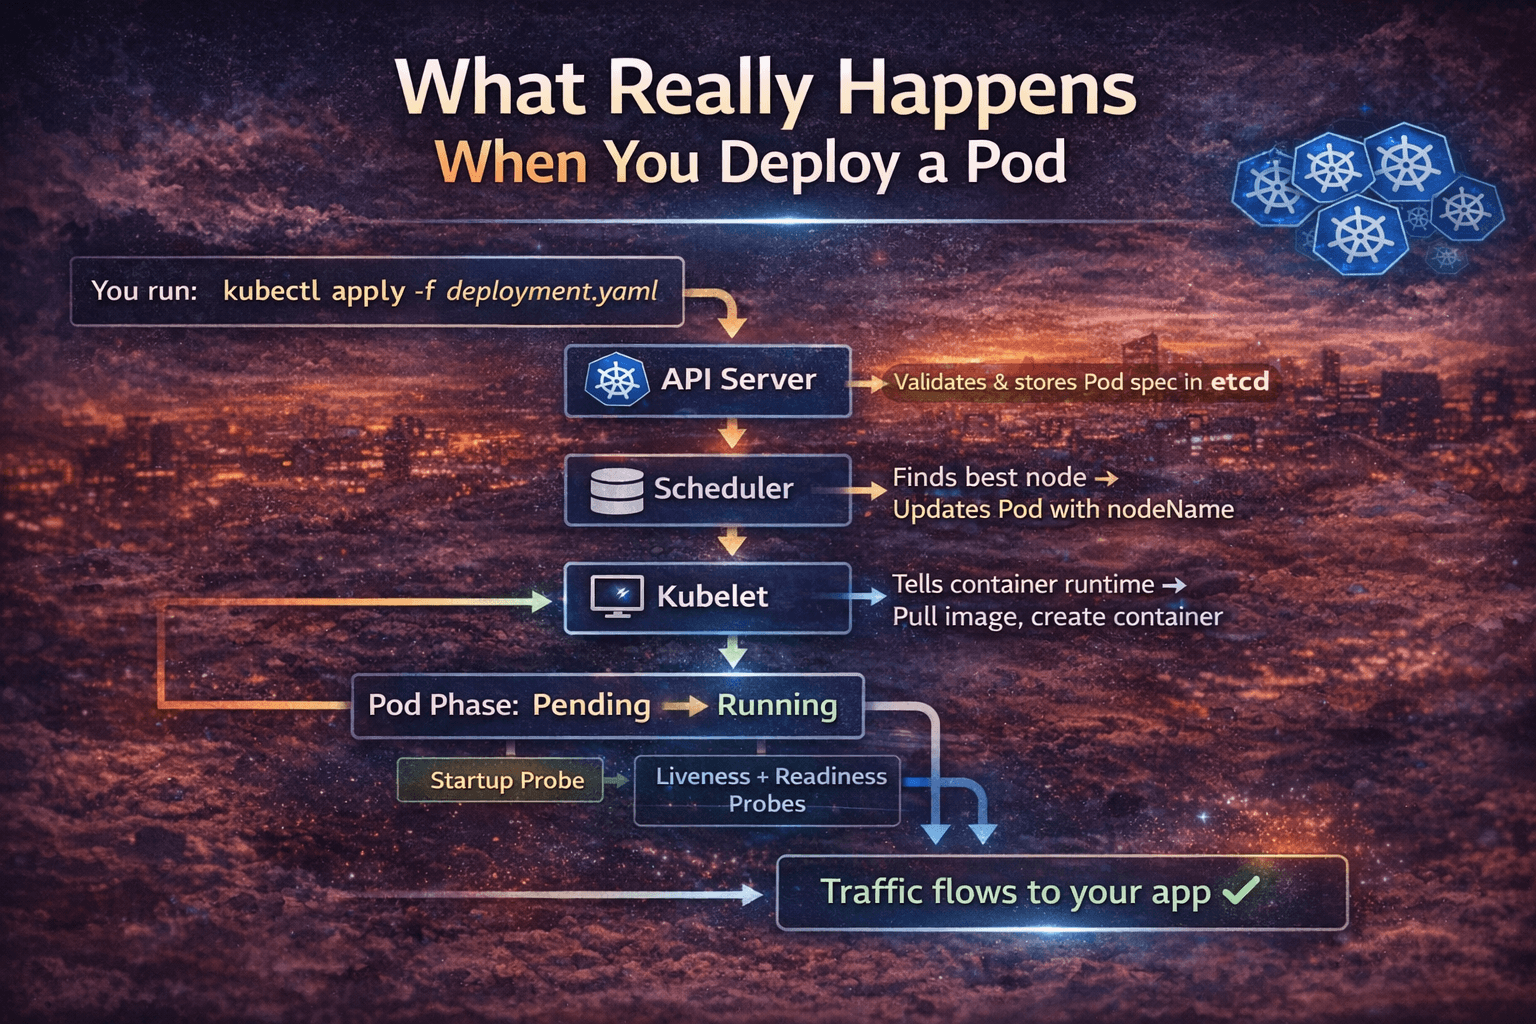
Here’s the complete journey from kubectl apply to your Pod serving traffic:
You run: kubectl apply -f deployment.yaml
         |
         v
API Server validates & stores Pod spec in etcd
         |
         v
Scheduler watches etcd → finds unscheduled Pod
         |
         v
Scheduler picks best node → updates Pod with nodeName
         |
         v
Kubelet on that node watches API Server → sees new Pod
         |
         v
Kubelet tells container runtime (containerd) → pull image, create container
         |
         v
Pod Phase: Pending → Running
         |
         v
Startup Probe runs (if configured)
         |
         v
Liveness + Readiness Probes begin
         |
         v
Readiness Probe passes → Pod IP added to Service Endpoints
         |
         v
Traffic flows to your app ✓
Every single step here can fail or delay. Understanding this chain is how you pinpoint exactly where things broke.
Restart Policies — Kubernetes Doesn’t Always Restart
A lot of beginners assume Kubernetes always restarts a failed Pod. It doesn’t. It depends on your restartPolicy.
| Policy | When to use | Behavior |
|---|---|---|
Always | Long-running services (APIs, web apps) | Restarts on any exit — crash or clean completion |
OnFailure | Batch Jobs | Restarts only on non-zero exit codes |
Never | One-shot tasks or debug Pods | Never restarts, regardless of exit code |
spec:
  restartPolicy: OnFailure  # Good for Kubernetes Jobs
Most Pods in a Deployment use Always by default. That’s fine for services, but if you’re running a Job and forget to set OnFailure, a successful run will still try to restart — causing unnecessary reruns.
CrashLoopBackOff — The Most Common Headache
CrashLoopBackOff is not a Pod phase. It’s a container state. And it’s something every Kubernetes engineer sees almost daily.
Here’s what it means: your container keeps crashing, and Kubernetes is throttling the restart attempts using exponential backoff:
10s → 20s → 40s → 80s → 160s → 300s (stays at 5 min max)
Kubernetes is essentially saying, “I’ll keep trying, but I’m not going to hammer the system if your app keeps dying.”
How to debug it:
# Step 1: Check current logs
kubectl logs <pod-name>

# Step 2: Check previous container logs (before crash)
kubectl logs <pod-name> --previous

# Step 3: Check events
kubectl describe pod <pod-name>

# Step 4: Check exit code
kubectl get pod <pod-name> -o jsonpath='{.status.containerStatuses[0].lastState.terminated.exitCode}'
Exit code cheat sheet:
0→ Clean exit (shouldn’t CrashLoop)1→ App error (check logs)137→ OOMKilled or SIGKILL (container killed — usually memory limit)139→ Segmentation fault143→ SIGTERM received (graceful shutdown signal)
Exit code 137 is extremely common. It means your container hit its memory limit and got killed. Fix: increase resources.limits.memory or fix a memory leak.
Health Probes — Your Lifecycle Control Panel
This is the most underused feature in Kubernetes, and it directly controls how your Pod behaves in the Running phase.
Startup Probe
For apps that take a long time to boot — legacy Java apps, apps loading large ML models, etc. It tells Kubernetes: “Don’t check liveness yet. Give this app time to start.”
startupProbe:
  httpGet:
    path: /healthz
    port: 8080
  failureThreshold: 30   # 30 attempts
  periodSeconds: 10      # every 10s = 5 minutes max startup time
Without this, a slow-starting app will get killed by the liveness probe before it even finishes booting. I’ve seen teams spend hours debugging random restarts on perfectly healthy apps — all because they were missing a startup probe.
Liveness Probe
Checks: “Is this container still alive and functional?”
If it fails, Kubernetes kills and restarts the container. Use this to detect deadlocks or hung processes that are technically “running” but doing nothing.
livenessProbe:
  httpGet:
    path: /healthz
    port: 8080
  initialDelaySeconds: 15
  periodSeconds: 20
  failureThreshold: 3
Readiness Probe
Checks: “Is this container ready to accept traffic?”
If it fails, the Pod is removed from the Service’s endpoint list. No traffic reaches it. When it recovers, it gets added back automatically. This is how you achieve zero-downtime during rolling updates.
readinessProbe:
  httpGet:
    path: /ready
    port: 8080
  initialDelaySeconds: 5
  periodSeconds: 10
The rule of thumb: Always use all three probes in production. Missing readiness probe = users hit a Pod that isn’t ready = 502 errors during deployments.
Init Containers — The Setup Crew
Before your main application container starts, you can run init containers. They run sequentially, must exit with code 0, and only then does the main container start.
Practical use cases:
- Wait for the database to be reachable before starting your app
- Run database migrations
- Fetch secrets or config files from an external source
- Set correct file permissions on shared volumes
initContainers:
- name: wait-for-db
  image: busybox:1.35
  command:
  - sh
  - -c
  - |
    until nc -z postgres-service 5432; do
      echo "Waiting for Postgres..."
      sleep 3
    done
    echo "Postgres is up!"
Without this, your app might start, fail to connect to DB, and enter CrashLoopBackOff — when the real problem is just a startup ordering issue.
Graceful Termination — Don’t Kill Your App Rudely
When you delete a Pod or do a rolling update, Kubernetes doesn’t just yank the plug. It follows a proper shutdown sequence:
Pod deletion triggered (kubectl delete / rolling update)
         |
         v
Pod status → Terminating
Pod removed from Service Endpoints (stops getting new traffic)
         |
         v
preStop hook runs (if configured)
         |
         v
SIGTERM sent to containers ("please shut down gracefully")
         |
         v
Kubernetes waits... (terminationGracePeriodSeconds, default: 30s)
         |
         v
If container still running → SIGKILL ("you had your chance")
         |
         v
Pod removed from etcd
If your app doesn’t handle SIGTERM, it ignores the graceful shutdown signal and gets force-killed after 30 seconds. This means in-flight requests get dropped.
Fix it properly:
spec:
  terminationGracePeriodSeconds: 60
  containers:
  - name: myapp
    lifecycle:
      preStop:
        exec:
          command: ["/bin/sh", "-c", "sleep 5"]
The sleep 5 in preStop gives kube-proxy time to remove the Pod from load balancer rules before your app starts shutting down. This tiny trick eliminates a ton of 502 errors during deployments.
Pod Conditions — The Detailed Status
Beyond the 5 phases, Kubernetes tracks conditions — granular boolean flags:
kubectl get pod <pod-name> -o jsonpath='{.status.conditions}' | python3 -m json.tool
| Condition | What it tells you |
|---|---|
PodScheduled: True | Node has been assigned |
Initialized: True | All init containers finished |
ContainersReady: True | All containers are running and healthy |
Ready: True | Pod is ready to serve traffic |
If Ready is False but ContainersReady is True, your readiness probe is failing. That’s a specific, actionable clue — way more useful than just “Pod not working.”
Common Issues and How to Actually Fix Them
| What you see | What it means | What to do |
|---|---|---|
Pending (forever) | No schedulable node | Check kubectl describe pod events |
ImagePullBackOff | Wrong image name or no registry credentials | Fix image tag or add imagePullSecrets |
CrashLoopBackOff | App keeps crashing | kubectl logs --previous, check exit code |
OOMKilled | Memory limit hit | Increase limits.memory or fix memory leak |
Terminating (stuck) | Finalizer blocking deletion | Manually patch out the finalizer |
Unknown | Node is offline | Check node health, cordon and drain |
0/1 Ready | Readiness probe failing | Check /ready endpoint, check probe config |
Mistakes I See All the Time
1. No resource limits set
# Bad — Pod can eat all node memory
containers:
- name: app
  image: myapp:latest

# Good
containers:
- name: app
  image: myapp:latest
  resources:
    requests:
      cpu: "250m"
      memory: "256Mi"
    limits:
      cpu: "500m"
      memory: "512Mi"
Without limits, one noisy Pod can starve every other workload on the node.
2. Using latest tag in production
latest is not a version. It changes without warning. Always pin to a specific image digest or tag like myapp:v1.4.2.
3. Only one replica for critical services
If that one Pod’s node goes down, your service is down. Always run at least 2–3 replicas for anything production-facing.
4. Ignoring the graceful shutdown
Not handling SIGTERM in your app = dropped requests on every deployment. Handle it. It takes 5 minutes and saves a lot of production pain.
5. Setting initialDelaySeconds too low
If your app takes 20 seconds to start but your liveness probe fires after 5 seconds, Kubernetes kills it before it even finishes booting. Always measure your actual startup time and set probes accordingly.
Quick Reference: Pod Lifecycle Cheat Sheet
textPENDING     → Accepted by API server, waiting to be scheduled
RUNNING     → On a node, at least one container running
SUCCEEDED   → All containers completed with exit code 0
FAILED      → One or more containers exited with non-zero code
UNKNOWN     → Node communication lost, state can't be determined

Restart Policies:
Always      → Default, restarts on any exit
OnFailure   → Restarts only on failure (non-zero exit)
Never       → Never restarts

Health Probes:
Startup     → Gates liveness/readiness until app is ready
Liveness    → Kills