😅 The Night Kubernetes Just… Froze
Let me tell you something that still stays with me. It wasn’t one of those loud production outages where everything turns red and alarms go crazy. It was worse. Things just quietly stopped working. We had pushed a deployment, everything in CI/CD was green, configurations looked perfect, and nothing seemed out of place. But new pods were not getting created. No errors, no warnings, just silence. We started checking everything step by step — nodes were healthy, images were available, configs were correct. After digging deeper, we finally found the issue: the API server was struggling because etcd had high latency. It wasn’t down, it wasn’t crashing, it was just slow enough to break everything. That moment changed how I looked at Kubernetes. It stopped feeling like just another tool and started making sense as a complete system.
🧠 Kubernetes Architecture (Explained Simply)
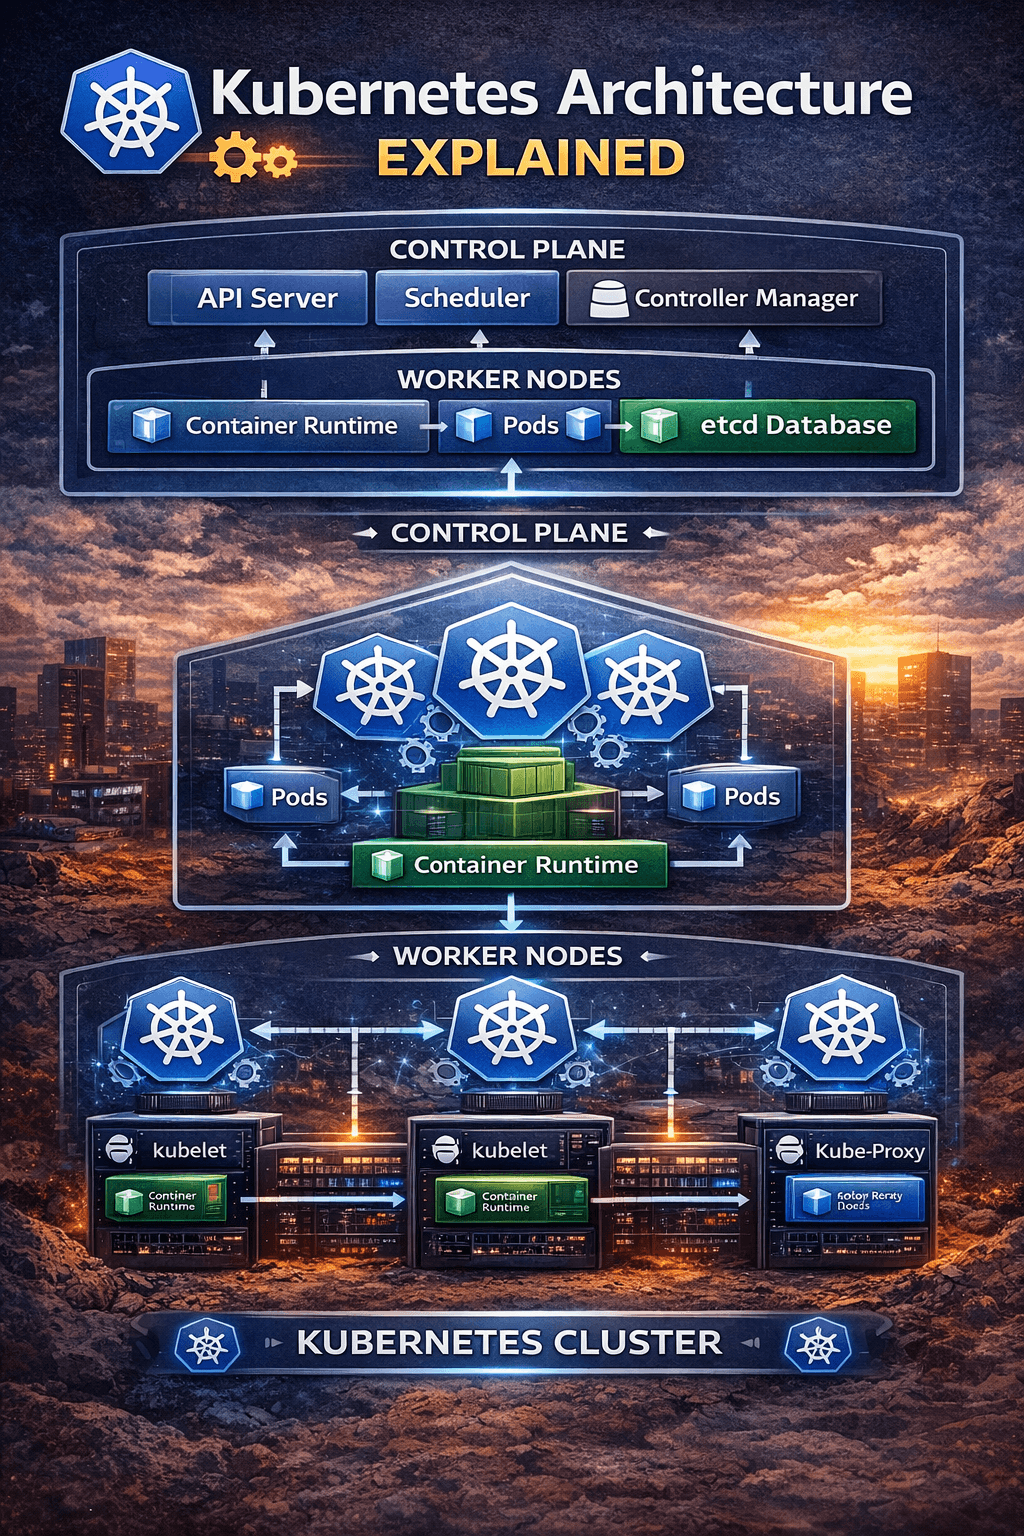
If Kubernetes feels overwhelming at first, you’re not alone. Most people try to understand it component by component and get lost. The easier way to think about it is this: Kubernetes is simply divided into two main parts — the control plane and the worker nodes. The control plane makes decisions, and the worker nodes execute those decisions. That’s it. Whenever something breaks, instead of trying random fixes, just ask yourself one simple question: is this a control plane issue or a node issue? This mindset alone can save you hours of confusion and unnecessary debugging.
⚙️ Understanding the Control Plane (The Brain)
Most of the confusing and “something feels off” type of issues usually originate in the control plane. This is where all the decisions are made, and even a small delay here can affect the entire cluster. The API server acts as the entry point for everything. Every command you run, every deployment you trigger, and every monitoring tool you use communicates through the API server. When it becomes slow or overloaded, you start seeing strange symptoms like hanging kubectl commands, delayed deployments, or tools not responding. I’ve seen teams spend hours debugging their applications when the real problem was just API server latency caused by too many incoming requests or a slow etcd backend.
The scheduler is another important but often misunderstood component. Its job is to decide where your pods should run. When pods are stuck in a “Pending” state, many beginners assume something is broken in their deployment. In reality, it’s usually the scheduler saying there are not enough resources available on any node. In such cases, checking CPU and memory requests is far more useful than redeploying again and again.
Then comes the controller manager, which is responsible for maintaining the desired state of the cluster. This is what gives Kubernetes its self-healing nature. If a pod crashes or a node goes down, the controller ensures that new pods are created automatically. I’ve seen this happen in real production scenarios where nodes failed, but the system recovered before anyone even reacted. However, it’s important to understand that Kubernetes only maintains what you define. If your configuration is wrong, it will consistently maintain that wrong state as well.
The most critical yet often ignored component is etcd. It stores everything — cluster state, configurations, and secrets. Think of it as the memory of your Kubernetes cluster. I’ve personally faced situations where slow disk performance caused etcd to lag, which in turn slowed down the API server and made the entire cluster unstable. The tricky part is that nothing completely fails; things just become unreliable. That’s why etcd performance, especially disk speed and latency, should never be ignored.
🖥️ Worker Nodes (Where Applications Actually Run)
While the control plane is responsible for decision-making, worker nodes are where your applications actually run, and this is where users feel the impact of any issue. Each node has a component called kubelet, which ensures that containers are running as expected and communicates with the control plane. If kubelet stops responding, the node becomes “NotReady,” and Kubernetes loses control over it, even if the containers are still running. This can be confusing because the application might still appear to be working, but the cluster considers the node unhealthy.
The container runtime is what actually runs your containers. If there are issues at this level, such as image pull failures or runtime crashes, your pods won’t start at all. A common mistake is focusing only on Kubernetes-level logs while ignoring runtime-level problems.
Networking is handled by kube-proxy, and this is where some of the most frustrating issues occur. I’ve seen cases where pods were running perfectly fine, health checks were passing, but the application was still unreachable. The root cause turned out to be a networking issue. This is why debugging should always include checking the full communication flow, not just the pod status.
🔄 How Everything Works Together
Once you understand how everything connects, Kubernetes becomes much easier to reason about. When you deploy an application, your request goes to the API server, which stores the desired state. The scheduler then decides which node should run the pod. The controller ensures that the desired state is maintained. The kubelet on the selected node starts the container, and kube-proxy handles routing traffic to it. When something breaks, instead of guessing, you can trace this flow and identify exactly where the failure is happening.
🔥 Common Production Mistakes
There are a few mistakes that I’ve seen repeatedly in real-world environments. Running a single control plane might work in development, but in production, it creates a single point of failure. If that goes down, your entire cluster becomes unusable. Ignoring etcd backups is another major risk, because losing etcd means losing your entire cluster state. Poor resource planning is also a common issue, where incorrect CPU and memory requests either prevent pods from being scheduled or overload nodes, causing instability. Lastly, many teams focus only on monitoring applications and ignore the control plane, which often leads to missing the actual root cause of issues.
🛠️ Practical Debugging Approach
Over time, I’ve developed a simple debugging approach that works consistently. I start by checking whether the cluster is reachable, then verify node health, and then look at pod status across namespaces. If needed, I dive deeper using describe commands and logs. But more important than the commands is the way you think. I always try to identify whether the issue belongs to the control plane, the node, or the application itself. Once that is clear, debugging becomes much faster and less stressful.
⚡ Pro Tips from Real Experience
One thing I’ve learned is to always design systems assuming that failures will happen, because they will. Use a highly available control plane, ensure etcd runs on fast SSD storage, and monitor API latency along with scheduler behavior. Set proper resource requests and limits, and test failure scenarios before they happen in production. These small practices make a huge difference during real incidents.
🧠 Final Thoughts
Kubernetes architecture is not something you fully understand by just reading documentation. You understand it when things break, when you trace the issue, and when you fix it. Once you start thinking in terms of which component is responsible for what, everything becomes clearer. You stop guessing, you stop panicking, and you start debugging with confidence. And that’s when Kubernetes shifts from being confusing to becoming one of the most powerful tools in your DevOps journey. 🚀
Reference Links
Use these in your blog (very important for Google ranking + credibility):
📘 Official Docs
- https://kubernetes.io/docs/concepts/overview/components/
- https://kubernetes.io/docs/concepts/architecture/
📚 Learning Resources
- https://kubernetes.io/docs/tutorials/
- https://www.redhat.com/en/topics/containers/kubernetes-architecture
- https://www.digitalocean.com/community/tutorials/an-introduction-to-kubernetes