It’s 11 PM. Your deployment just went out. Slack is blowing up. You check the cluster and see it — that dreaded status:
NAME READY STATUS RESTARTS AGE
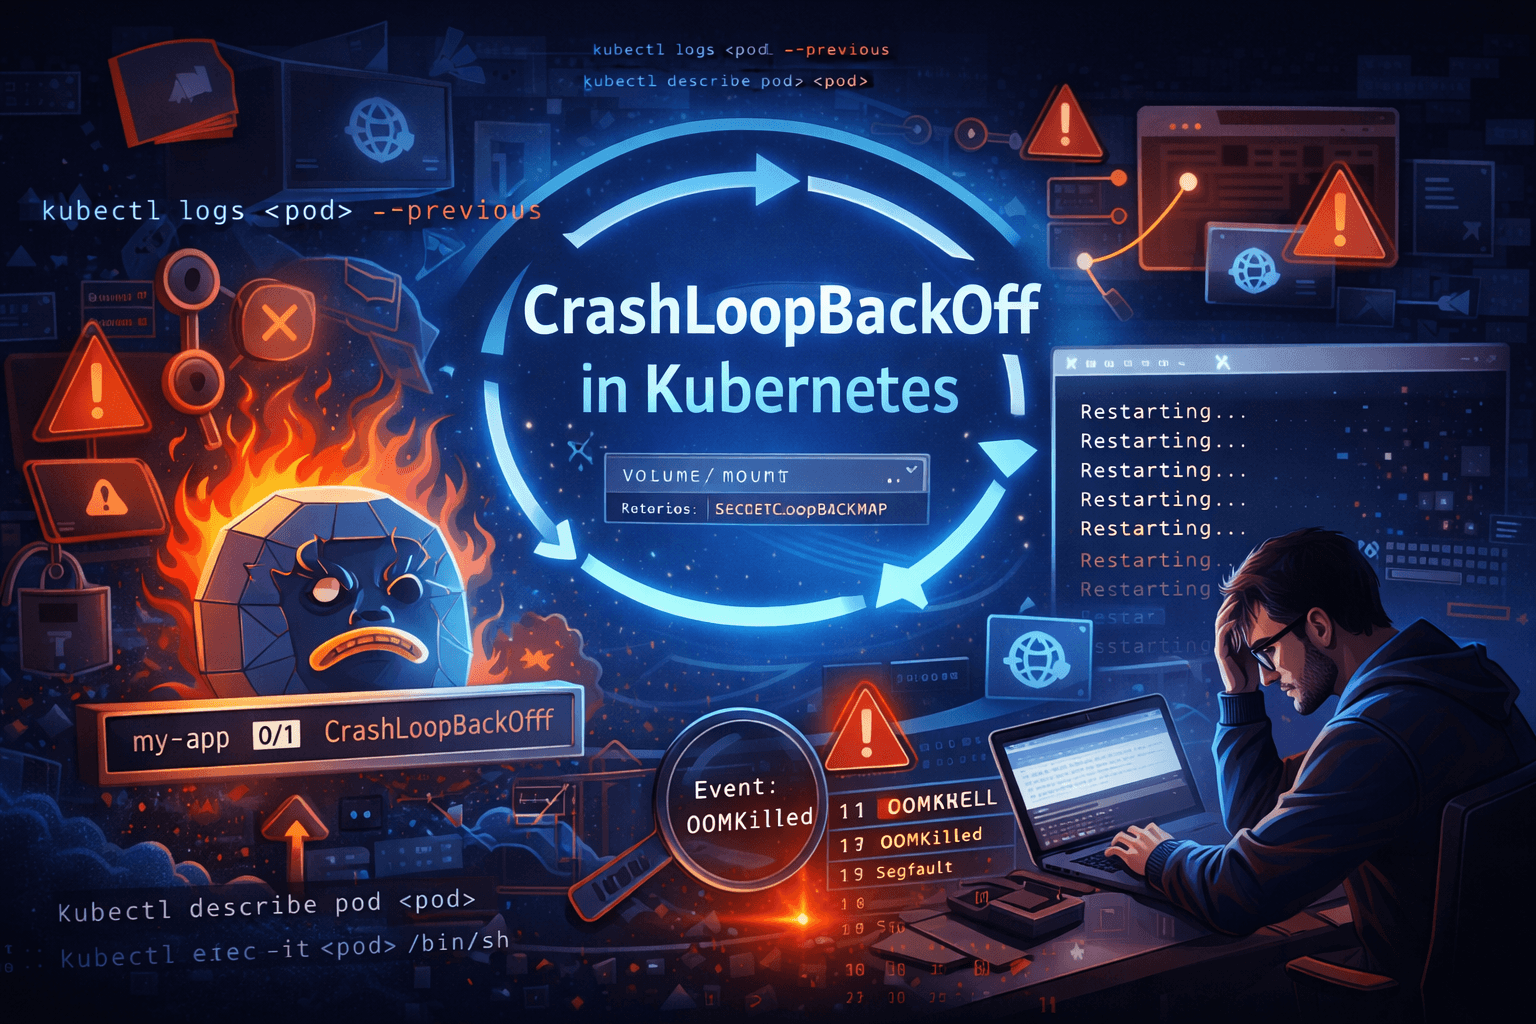
my-app-7d9f8b 0/1 CrashLoopBackOff 8 12m
Eight restarts. Climbing. And you have no idea why.
If you’ve worked with Kubernetes for more than a week, you’ve seen this. CrashLoopBackOff is probably the single most common issue engineers hit — and also the most misunderstood. People panic when they see it, when really it’s just Kubernetes politely telling you: “Your container keeps dying. I’ll keep trying, but something is wrong on your end.”
Let me walk you through exactly what this means, why it happens, and how to debug it like someone who actually knows what they’re doing.
What is CrashLoopBackOff — Really?
First, let’s clear something up. CrashLoopBackOff is not a Pod phase. It’s a container state. The Pod itself might show as Running — but inside, the container is stuck in a crash-restart loop.
Here’s the breakdown of what’s happening:
- Kubernetes starts your container
- Container crashes (exits with a non-zero code)
- Kubernetes restarts it (as per the restart policy)
- It crashes again
- Kubernetes waits a bit longer before the next restart (backoff)
- Rinse and repeat
The “BackOff” part is important. Kubernetes doesn’t spam restarts. It uses exponential backoff — it increases the wait time between each restart attempt:
Restart 1 → wait 10s
Restart 2 → wait 20s
Restart 3 → wait 40s
Restart 4 → wait 80s
Restart 5 → wait 160s
Restart 6+ → wait 300s (5 minutes max — stays here)
This is actually smart. If your app is broken, hammering restarts every second would just eat resources. The backoff gives you time to investigate without the cluster melting.
The restart counter you see? That tells you how many times the container has crashed. A count of 8 in 12 minutes means it hit the 5-minute cap and is stuck cycling there.

Why Does CrashLoopBackOff Happen?
There’s no single cause. That’s what makes it annoying to debug. Here are the most common culprits:
1. The Application Crashes on Startup
This is the #1 cause. Your app starts, hits an error in the first few seconds, and exits. Classic scenarios:
- Connecting to a database that isn’t ready yet
- Reading an environment variable that doesn’t exist
- Failing to bind to a port (port already in use or wrong port configured)
- Unhandled exception during initialization
The app just dies immediately. Kubernetes sees exit code 1 (or similar) and restarts it. Same crash. Same restart. Loop.
2. Wrong or Missing Environment Variables
Your app expects DB_HOST=postgres-service but the env var isn’t set — or is set to the wrong value. The app tries to connect to a null/wrong host, fails, throws an exception, exits.
# This missing env var can destroy your entire deployment
env:
- name: DB_HOST
  value: ""   # <- empty, app crashes immediately
I’ve seen a typo in a secret name cause 45 minutes of debugging. The Pod showed CrashLoopBackOff, logs were confusing, and the entire issue was a wrong key name in valueFrom.secretKeyRef.
3. Missing ConfigMaps or Secrets
If your Pod references a ConfigMap or Secret that doesn’t exist in the namespace, the Pod won’t even start. It’ll go straight into a failed state.
envFrom:
- secretRef:
    name: app-secrets   # If this secret doesn't exist → Pod crashes
Always double-check your secret/configmap names and namespaces.
4. Misconfigured Volume Mounts
Your app expects a file at /app/config/settings.yaml but the volume isn’t mounted correctly — or the path is wrong. App starts, tries to read the file, gets a “file not found” error, crashes.
5. OOMKilled — Out of Memory
Your container hit its memory limit and Kubernetes killed it with a SIGKILL. This shows up as exit code 137.
resources:
  limits:
    memory: "128Mi"   # App actually needs 512Mi → OOMKilled every time
The tricky part: the Pod restarts, does whatever work spikes the memory, hits the limit, gets killed again. Perfect loop.
6. Liveness Probe Misconfiguration
This one catches a lot of people. Your app is actually running fine — but your liveness probe is checking the wrong endpoint, or firing before the app is ready, or has too-tight thresholds.
Kubernetes thinks the app is unhealthy, kills it, restarts it, kills it again. The app itself is healthy. The probe config is the problem.
7. The Container Command is Wrong
containers:
- name: myapp
  image: myapp:v1.2
  command: ["python", "app.py"]   # But the file is actually main.py
Container starts, Python can’t find app.py, exits with code 2. Instant CrashLoopBackOff.
How to Debug CrashLoopBackOff — Step by Step
Don’t guess. Follow this exact order every time.
Step 1: Check the Restart Count and Age
kubectl get pods -n <namespace>
Look at the RESTARTS column and the AGE. High restarts in a short time = fast-crashing app. High restarts over a long time = intermittent issue (memory leak, cron-like crashes).
Step 2: Describe the Pod — Read the Events
kubectl describe pod <pod-name> -n <namespace>
Scroll to the bottom — the Events section is gold. It tells you:
- Why the container exited (OOMKilled, Error, etc.)
- Whether image pull failed
- Whether volumes failed to mount
- Whether the liveness probe killed it
Look for lines like:
Back-off restarting failed container
OOMKilling container with id...
Failed to pull image...
Liveness probe failed: HTTP probe failed...
Each of these points to a completely different fix.
Step 3: Check the Exit Code
kubectl get pod <pod-name> -o jsonpath=\
'{.status.containerStatuses[0].lastState.terminated.exitCode}'
This single number tells you a lot:
| Exit Code | Meaning | What to do |
|---|---|---|
0 | Clean exit — shouldn’t CrashLoop | Check liveness probe |
1 | Generic app error | Check logs |
2 | Misuse of shell command | Check CMD/ENTRYPOINT |
137 | OOMKilled or SIGKILL | Increase memory limits |
139 | Segmentation fault | App-level bug, check logs |
143 | SIGTERM received | Graceful shutdown — check if intentional |
Exit code 137 is the most common surprise. Engineers assume it’s an app bug, spend an hour in logs, and miss the fact that the container was simply killed for exceeding memory limits.
Step 4: Read the Logs — Including Previous Container Logs
# Current container logs
kubectl logs <pod-name> -n <namespace>

# Previous container logs (BEFORE it crashed) ← most important
kubectl logs <pod-name> -n <namespace> --previous
The --previous flag is something a lot of beginners don’t know about. By the time you run kubectl logs, the crashed container is gone and a new one has started. The logs you see are from the new (also about to crash) container — often showing nothing useful.
--previous shows you the dying words of the last container. The actual error that caused the crash. This is where 80% of your answers are.
Step 5: Check ConfigMaps and Secrets
# Verify the secret exists in the right namespace
kubectl get secret <secret-name> -n <namespace>

# Verify the configmap exists
kubectl get configmap gmap-name> -n <namespace>

# Check what keys are inside the secret
kubectl describe secret <secret-name> -n <namespace>
A missing secret or wrong key name is silent — the Pod just crashes. No clear error unless you dig.
Step 6: Check Resource Usage
kubectl top pod <pod-name> -n <namespace>
If the Pod restarts before you can check, look at the describe output for OOMKilled. Also review what limits are set:
kubectl get pod <pod-name> -o jsonpath=\
'{.spec.containers[0].resources}'
Step 7: Exec Into a Running Container (If You Can Catch It)
If the container stays up for even a few seconds, shell into it and poke around:
kubectl exec -it <pod-name> -n <namespace> -- /bin/sh
Check if config files exist, if env vars are set, if the app binary is in the right path. Sometimes just listing the directory reveals the problem instantly.
Real-World CrashLoopBackOff Scenarios
Scenario 1 — The Database Wasn’t Ready
Your app deployment goes out at the same time as a new database deployment. The app starts up, tries to connect to Postgres, gets “connection refused” because Postgres is still initializing, throws an unhandled exception, and crashes.
Fix: Use an init container to wait for the DB before the app starts.
initContainers:
- name: wait-for-db
  image: busybox:1.35
  command:
  - sh
  - -c
  - |
    until nc -z postgres-service 5432; do
      echo "Postgres not ready, waiting..."
      sleep 3
    done
    echo "Postgres is up. Starting app."
This runs first. Only when it exits with code 0 does the main app container start. No more race condition.
Scenario 2 — The OOMKilled Loop
A Java Spring Boot application deployed with memory: 256Mi limit. JVM wants at least 512Mi to breathe. Every time the app starts, it loads classes, fills up the heap, hits 256Mi, gets killed by the kernel. Exit code 137. Restart. Same thing.
The logs show nothing useful because the app never even finishes booting before it’s killed.
Fix:
resources:
  requests:
    memory: "512Mi"
    cpu: "250m"
  limits:
    memory: "1Gi"
    cpu: "500m"
Also add JVM flags to respect container memory:
textJAVA_OPTS: "-XX:MaxRAMPercentage=75.0 -XX:InitialRAMPercentage=50.0"
Scenario 3 — The Wrong Liveness Probe
App takes 45 seconds to fully start (loading ML model, cache warmup, etc.). Liveness probe is configured with initialDelaySeconds: 10. Kubernetes starts probing at 10 seconds, app isn’t ready yet, probe fails 3 times, Kubernetes kills the container. New container starts. Same thing. Loop.
The app is perfectly healthy. The probe config is the killer.
Fix:
startupProbe:
  httpGet:
    path: /healthz
    port: 8080
  failureThreshold: 30   # 30 × 5s = 150 seconds max startup time
  periodSeconds: 5

livenessProbe:
  httpGet:
    path: /healthz
    port: 8080
  initialDelaySeconds: 0   # Startup probe guards this now
  periodSeconds: 15
  failureThreshold: 3
The startup probe acts as a gate — liveness doesn’t run until startup succeeds.
Scenario 4 — The Missing Secret
New microservice deployed. References a secret payment-api-keys via envFrom. But that secret was created in the production namespace, not staging. Pod goes to CrashLoopBackOff immediately.
kubectl describe pod shows:
Error: secret "payment-api-keys" not found
Easy fix — create the secret in the right namespace. But how many times have you seen a team spend an hour on this? Namespace mismatches are sneaky.
How to Prevent CrashLoopBackOff Before It Happens
Debugging is reactive. Here’s how to be proactive:
1. Always set proper resource requests and limits
Don’t leave them empty. Profile your app’s actual usage and set reasonable values. Under-provisioning = OOMKilled loop.
2. Use all three health probes correctly
Startup probe for slow-starting apps, liveness for detecting deadlocks, readiness for traffic control. Configure initialDelaySeconds based on your actual startup time.
3. Handle SIGTERM in your app
When Kubernetes sends a graceful shutdown signal, your app should catch it and exit cleanly with code 0. If it ignores SIGTERM and Kubernetes force-kills it with SIGKILL, you get exit code 137 and a misleading CrashLoopBackOff.
4. Validate all config and secrets before deployment
# Quick check before applying
kubectl get secret <secret-name> -n <namespace>
kubectl get configmap gmap-name> -n <namespace>
Make this part of your deployment checklist or CI pipeline.
5. Use Init Containers for dependency ordering
Never assume your dependencies are ready when your app starts. Always use init containers to verify. This eliminates an entire category of CrashLoopBackOff issues.
6. Test your Docker image locally first
docker run --env-file .env myapp:v1.2
If it crashes locally, it’ll crash in Kubernetes too. Catch it early.
Quick Debug Cheatsheet
# 1. See restart count
kubectl get pods -n <namespace>

# 2. Read events and exit reason
kubectl describe pod <pod-name> -n <namespace>

# 3. Get exit code
kubectl get pod <pod-name> -o jsonpath='{.status.containerStatuses[0].lastState.terminated.exitCode}'

# 4. Read crash logs
kubectl logs <pod-name> --previous -n <namespace>

# 5. Check resource usage
kubectl top pod <pod-name> -n <namespace>

# 6. Verify secrets/configmaps exist
kubectl get secret <name> -n <namespace>
kubectl get configmap <name> -n <namespace>

# 7. Shell into container (if alive long enough)
kubectl exec -it <pod-name> -n <namespace> -- /bin/sh
Save this. Seriously. You’ll use it more than you think.
Mistakes People Make When Debugging
Restarting the Pod and hoping it fixes itself.
It won’t. CrashLoopBackOff doesn’t self-heal. The underlying problem is still there. Deleting and reapplying without fixing the root cause just resets the restart counter.
Reading current logs instead of previous logs.
By the time you run kubectl logs, the crashed container is already replaced. Always use --previous.
Assuming the problem is in the application code.
Often it’s infrastructure — a missing secret, wrong env var, insufficient memory, bad probe config. Check the environment before diving into code.
Increasing memory limits as the first fix.
Understand why the memory is spiking first. A memory leak won’t be fixed by raising limits — it’ll just crash slower.
Wrapping Up
CrashLoopBackOff sounds scary when you first see it. After you’ve debugged it a few dozen times, it becomes almost routine