Introduction
You deploy an app, things look healthy — then an error surface: slow responses, mysterious connection resets, a memory leak. The usual options are ugly: restart the pod and lose state, attach a sidecar after the fact, or reproduce the bug in staging (which might not reproduce).
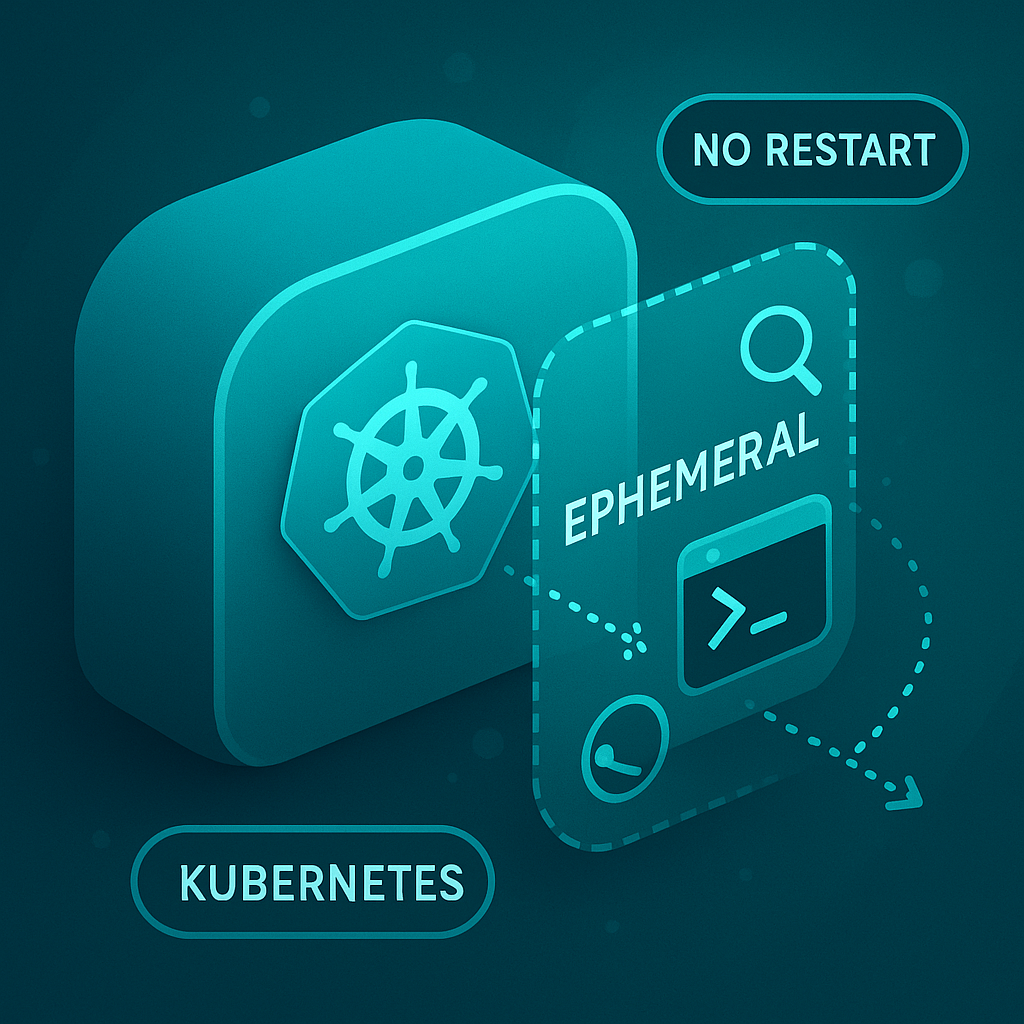
Enter ephemeral containers — a lightweight, on-demand container you inject into a running pod to inspect, probe, and debug without restarting your production container. Think of them as a temporary SSH session for containers that weren’t built with debug tooling. They’re fast, surgical, and often lifesaving.
In this post you’ll learn what ephemeral containers are, how to use them with practical commands, and how to do it safely in production.

What are ephemeral containers?
- Definition: Short-lived containers added to a running pod for debugging. They do not change the pod’s restart count or lifecycle; they are ephemeral by design.
- Purpose: Run inspection tools (bash, strace, tcpdump, nsenter) inside the pod’s namespaces (network, PID, IPC) so you can diagnose issues in situ.
- Important property: They don’t replace or restart existing containers — they join the pod’s namespaces so you can inspect the actual runtime.
When to use ephemeral containers (real scenarios)
- Investigating network connectivity issues from inside the pod (DNS, routing, iptables).
- Capturing packets with
tcpdumpwhile the application is running. - Inspecting process state with
ps,strace, orgdbon live processes. - Reading ephemeral logs or dumping memory (for advanced debugging).
- Troubleshooting environment-specific bugs only visible in production.
Quick prerequisites & safety checks
- Kubernetes control plane version should support ephemeral containers (modern Kubernetes versions do). If not available, your cluster admin may need to enable the feature or upgrade.
- You need RBAC permissions to create ephemeral containers (the
pods/ephemeralcontainerssubresource). - Debug images often require elevated capabilities; coordinate with security/ops before running privileged containers.
Hands-on: Common kubectl workflows
1) Fast attach using kubectl debug (recommended)
kubectl debug is the easiest path — it creates an ephemeral container with your chosen image and attaches you interactively.
# attach an interactive shell using netshoot (includes tcpdump, nslookup, etc.)

kubectl debug -it pod/my-app-pod --image=nicolaka/netshoot -- /bin/bash

# attach and target a specific container (namespace join)

kubectl debug -it pod/my-app-pod --container=my-app-container --image=nicolaka/netshoot -- /bin/bash
Once inside, run familiar commands:
# inspect network
nslookup api.service.cluster.local
curl -v http://10.42.5.12:8080/healthz
tcpdump -i any -nn -s0 -w /tmp/capture.pcap

# inspect processes
ps aux
strace -p <pid> -s 200
To copy capture.pcap off the pod:
kubectl cp my-namespace/my-app-pod:/tmp/capture.pcap ./capture.pcap
2) Add ephemeral container via JSON patch (useful for automation)
You can patch the Pod subresource directly if kubectl debug isn’t available or you need to automate:
- Create a JSON patch:
[
  {
    "op": "add",
    "path": "/spec/ephemeralContainers/-",
    "value": {
      "name": "debugger",
      "image": "nicolaka/netshoot:latest",
      "command": ["/bin/bash","-c","sleep 1d"],
      "stdin": true,
      "tty": true,
      "securityContext": {
        "privileged": true
      }
    }
  }
]
- Apply the patch:
kubectl patch pod my-app-pod -n my-namespace --type='json' -p "$(cat patch.json)"
kubectl attach -it -n my-namespace pod/my-app-pod -c debugger
Note: The Pod manifest will show
spec.ephemeralContainerswith the injected container.
3) Inspect ephemeral containers and lifecycle
kubectl describe pod my-app-pod -n my-namespace
# look for Ephemeral Containers section

# list pods and show ephemeralContainers field
kubectl get pod my-app-pod -n my-namespace -o jsonpath='{.spec.ephemeralContainers}'
Useful debugging images and tools
- nicolaka/netshoot — swiss-army knife for network debugging (tcpdump, dig, traceroute).
- busybox / alpine — small shells and basic tools.
- ghcr.io/someorg/debug-tools — your internal debug images with approved tooling (recommended for security).
Security, governance & compliance
Ephemeral containers are powerful and therefore need guardrails:
- RBAC: Limit
pods/ephemeralcontainersto trusted SRE/incident teams. - Admission controllers / Policy: Use OPA/Gatekeeper to restrict images, disallow
privilegedunless explicitly approved, and log actions. - Audit logs: Ensure ephemeral container creation is audited for post-incident review.
- Approved debug images: Maintain a curated registry of debug images signed by your security team.
- Secrets handling: Never inject secrets via ephemeral containers; if necessary, use short-lived approaches and explicit approvals.
Common pitfalls & tips
- Not joining PID namespace: If you need to inspect processes of the target container, ensure the ephemeral container shares the PID namespace or use
--target. - Image pull issues: Use images that exist in your cluster’s internal registry to avoid pull failures in locked-down environments.
- Network policies: Even if you attach an ephemeral container, NetworkPolicies still apply — verify that policy allows the needed flows.
- Sidecar alternatives: If your app needs long-term debugging or ongoing metric collection, consider a deliberate, reviewed sidecar instead of ephemeral injection.
Best practices (SRE checklist)
- Create an “SRE debug runbook” that documents approved images, RBAC steps, and commands to run.
- Use
kubectl debugby default — it’s simpler and tends to be supported across kubectl versions. - Automate ephemeral setup for common incidents (e.g., a script that injects netshoot + tcpdump and captures 1 minute).
- Rotate debug images and keep them minimal to reduce attack surface.
- Never use ephemeral containers as a permanent fix — they are a diagnostic tool, not a patch.
Conclusion
Ephemeral containers are one of the least disruptive, highest-value tools for diagnosing real production problems. They let you peek inside a running pod without the cost of restarts or the overhead of long-term sidecars. Combined with good security governance and a solid runbook, ephemeral containers make your SRE team faster, safer, and more effective.
Next time you face a production mystery, you won’t need to guess — you’ll inject, inspect, and resolve like a pro.

